With a plethora of SEO metrics vying for your attention, it’s important to separate the wheat from the chaff. But the question is: how do you differentiate between useful SEO metrics and vanity metrics? We’ve got you covered. In this article, we’ll take an in-depth look at 10 SEO metrics that are worth tracking. By the time you’re done, you’ll know exactly which SEO metrics to focus on and which ones to ignore. Side note: To track some of these metrics, you’ll need to subscribe to a premium SEO tool. Out of all the SEO tools out there, Semrush is my personal favorite. In my decade-long experience in the SEO field, I’ve learned that Semrush provides the most accurate and comprehensive insights on critical SEO metrics. Click here to sign up for a free one-month trial of Semrush (worth $119.95) Having said that, Semrush is not cheap. With prices starting at $119.95/month, Semrush is not everyone’s cup of tea. Especially for entrepreneurs or bloggers who are just starting out. If you’re looking for a budget-friendly alternative to Semrush, I’d highly recommend GrowthBar. Check out my full review of GrowthBar to learn more about this highly underrated SEO tool or sign up for a 5-day free trial to test it out for yourself.
10 Most Important SEO Metrics
1. Organic Traffic
Let’s start with the most obvious and perhaps the most important SEO metric you should be tracking — organic traffic.
10 Most Important SEO Metrics1. Organic Traffic2. Keyword Rankings3. Referring Domains4. Core Web Vitals5. Mobile Traffic6. Indexed Pages7. Traffic Cost8. Website Health Score9. Average Clickthrough Rate (CTR)10. Bounce RateFinal Thoughts on SEO Metrics
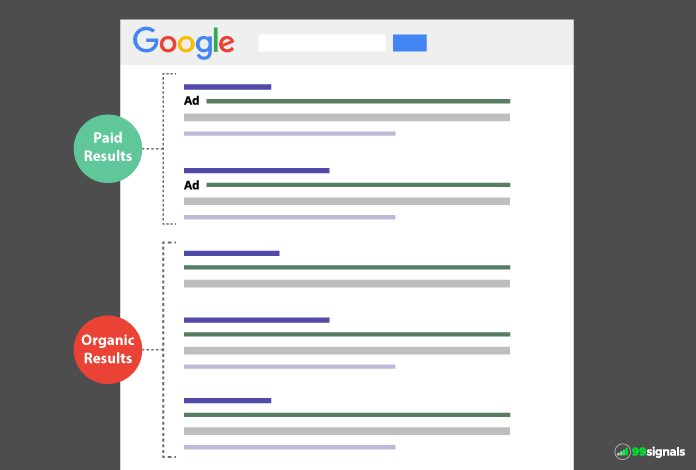
Organic traffic is any traffic that comes to your site from a search engine that doesn’t include traffic from paid results.
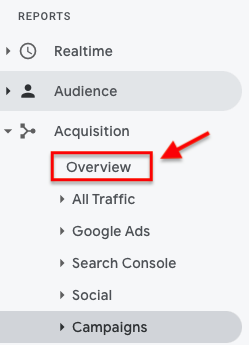
The easiest way to track your organic traffic is via Google Analytics. Here’s how to do it: From your Google Analytics dashboard, navigate to: Acquisition > Overview
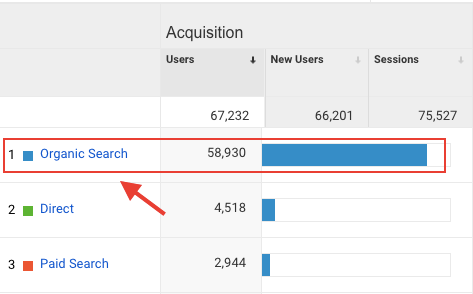
Here you can view the different traffic sources to your site, including organic search.
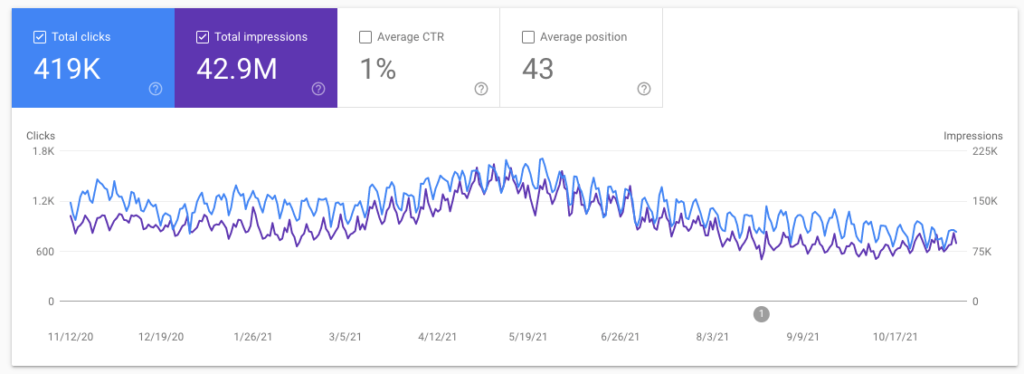
It’s that simple. You can also track organic traffic in Google Search Console. Login to your GSC account and visit the performance tab to view your organic traffic data.
In addition to these two free tools, you can use Semrush or Ahrefs to keep a tab on your site’s organic performance. If you’re a Semrush user, you can track your site’s organic traffic by entering your domain in the search box. The resulting overview report will have a column on the domain’s organic search traffic.
Click through the number to view the organic keywords that are bringing traffic to your site. We’ll cover organic keywords in greater depth next. But here’s an important caveat: SEO tools like Semrush and Ahrefs can only show the estimated traffic of a particular website. You may not always get an accurate representation of a site’s organic traffic. But based on my personal experience, the organic traffic data in Semrush is pretty close to the actual figure that you see in Google Analytics.
2. Keyword Rankings
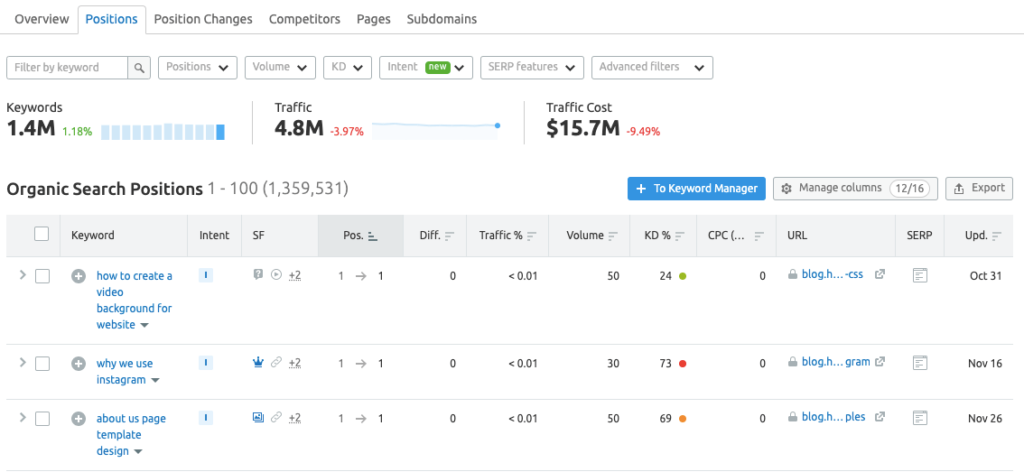
Keyword rankings refer to a website’s organic ranking positions for different keywords. It’s an SEO best practice to keep a tab on the performance of your most important keywords. Ideally, these are a set of keywords that are most relevant to your business and industry. The best way to check your keyword rankings is to view the organic keywords report in premium SEO tools like Semrush, Ahrefs, or GrowthBar. In my experience, Semrush gives the most comprehensive and accurate data on keyword rankings. Semrush’s position tracking tool even lets you to add and track the most important keywords that you’d like to have on your radar. Why is this important? Because it lets you keep a track of the keywords that really matter to your business. This is especially important if you have a large site and rank for a boatload of keywords. With a rank tracker like Semrush’s position tracking tool, you can narrow your focus down and zero-in on improving the rankings of priority keywords for your business. To set up position tracking in Semrush, go through this sequence: Keyword Research > Position Tracking > Set up Add the necessary details here, including a list of keywords that you’d like to track.
In a few minutes, Semrush will generate your position tracking report, where you’ll see data and graphs on your best performing keywords, search visibility metrics, rankings distribution graph, and more.
Scroll down to see your top 5 organic keywords, alongside columns for keywords with positive impact (improved rankings) and keywords with negative impact (decreased rankings). Hit the “View all” button below each of these columns to open the detailed position tracking report. You can check the position tracking report from time to time or choose to get regular email alerts on the progress of your tracked keywords. There’s another, much faster way to check your rankings in Semrush. And that is to view your organic keywords report. To view your rankings in Semrush, just plug your domain in the search box and click through the number in the Organic Search column. You’ll then see a list of all the organic keywords your site is currently ranking for.
From here, you can use advanced filters and sorting options to arrive at the data you need. If you’re using GrowthBar, you can view your organic keywords by visiting the “Site Inspector” tab and typing in your domain.
Here you can view all the organic keywords your site is currently ranking for. You can also download a CSV file of these keywords for later reference.
3. Referring Domains
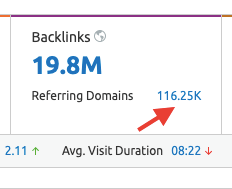
Referring domains are websites that are linking to your website. Despite numerous algorithm updates over the years, backlinks still remain one of the top three Google ranking factors. Recently, Backlinko conducted a Google SERP analysis of 11 million websites and found that there is a strong correlation between total number of backlinks and higher rankings. No surprises there. But what was interesting, though, is that websites with lots of referring domains tend to rank higher in SERPs. What’s the significance of this finding? Referring domains and backlinks are not the same. Referring domains are not the total number of backlinks pointing to your site. Referring domains are different websites that link to your domain. Here’s the thing: Google values links from different websites a lot more than links from the same website. Which is why it’s important that you focus more on referring domains than total backlinks. Bottom line: The more authoritative referring domains you have pointing to your site, the more likely you are to rank higher in Google organic search. You can check your referring domains in Semrush by plugging your domain into the search bar. In the overview report, check the number reflecting against “Referring Domains” in the “Backlinks” section.
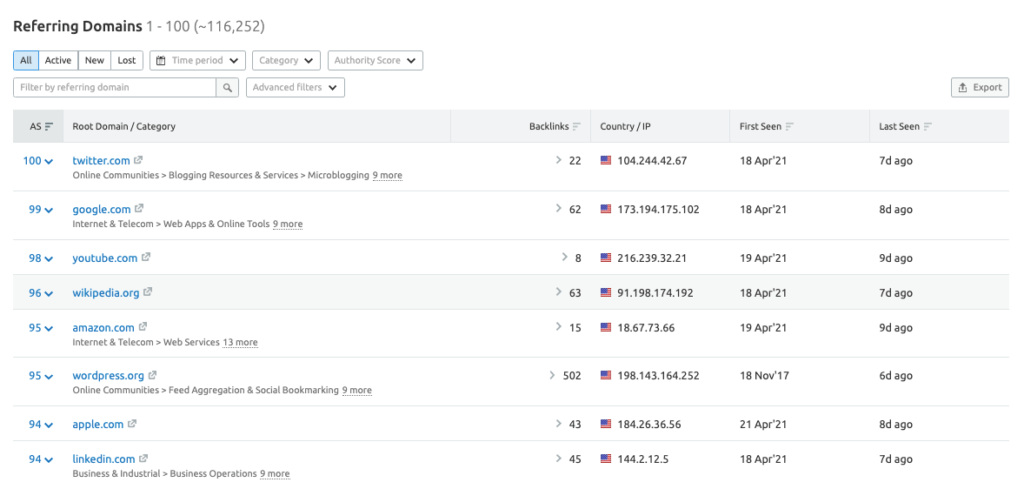
Click through this number to open the Referring Domains report to check the quality of the domains pointing to your site.
You can use the sorting and advanced filtering options to skim through this data and deep dive into the referring domains that are pointing to your site.
4. Core Web Vitals
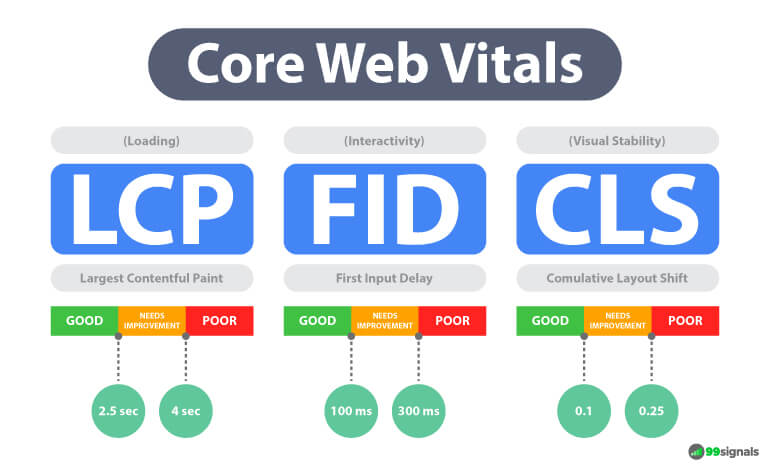
Core Web Vitals (CWV) are a set of three important technical SEO metrics that measure your site’s speed and performance.
Here’s how Google explains Core Web Vitals in their own quirky way: Core Web Vitals are a set of real-world, user-centered metrics that quantify key aspects of the user experience. They measure dimensions of web usability such as load time, interactivity, and the stability of content as it loads (so you don’t accidentally tap that button when it shifts under your finger – how annoying!). Below are the three CWV metrics:
Largest Contentful Paint (LCP) – measures when the largest content element in the viewport becomes visible. First Input Delay (FID) – measures the time from when a user first interacts with your site to the time when the browser is actually able to respond to that interaction. Cumulative Layout Shift (CLS) – measures all layout shifts that aren’t caused by user interaction.
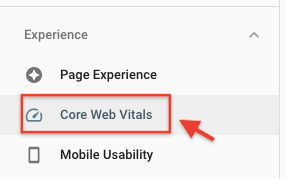
So why are core web vitals suddenly so important? Because these three core web vitals are now ranking signals. Google’s page experience algorithm update, which was rolled out in May 2021, combines existing user experience signals like mobile-friendliness, HTTPS, safe browsing, etc. with core web vitals. How do you track your core web vitals? There are several ways, but the easiest way is to access the core web vitals report in your Google Search Console account. To access this report, login to your GSC account and navigate to: Experience > Core Web Vitals
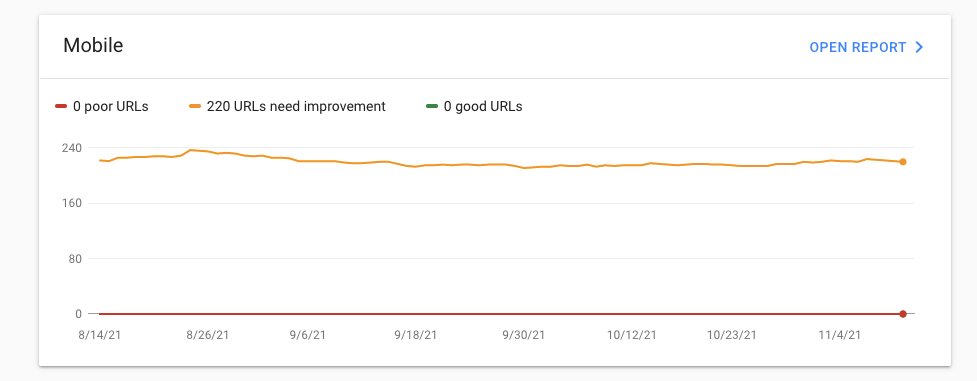
The CWV report will categorize your site’s URLs into three categories for both desktop and mobile:
Good URLs Poor URLs URLs that need improvement
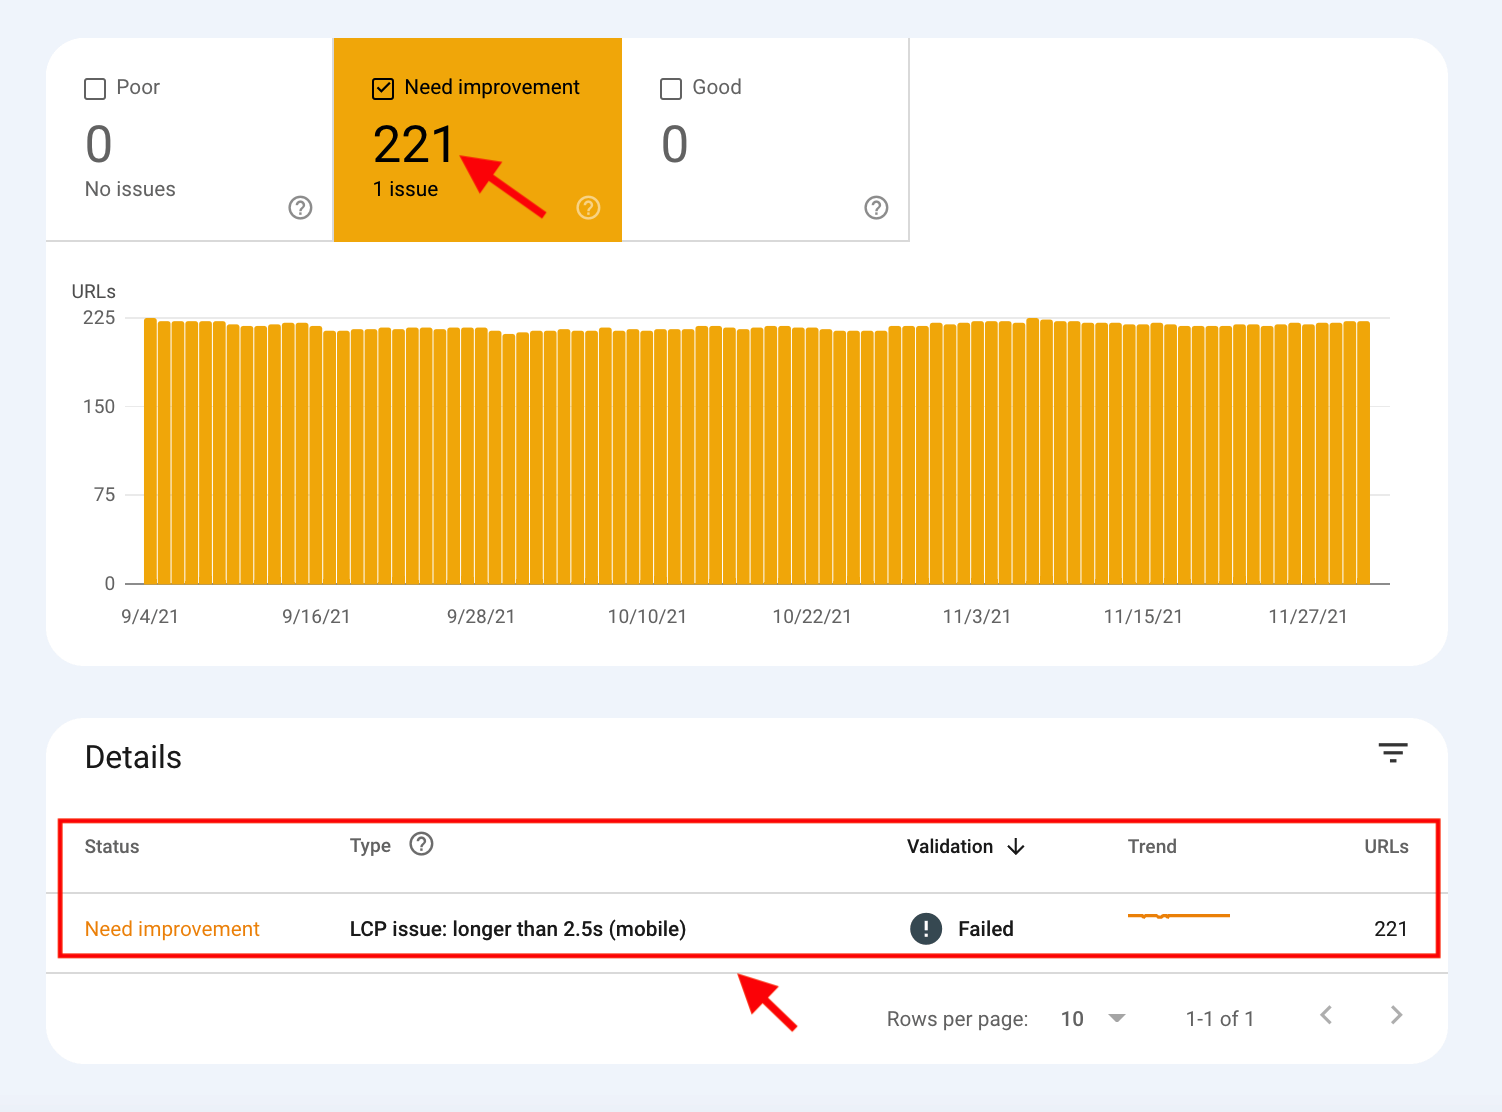
Needless to say, you need to pay special attention to poor URLs followed by URLs that need improvement. Inside the report, you can find more details on the issues and a list of affected URLs.
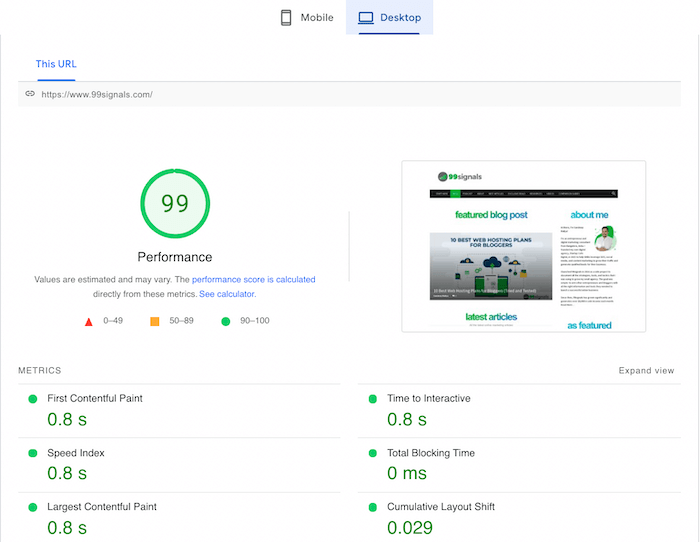
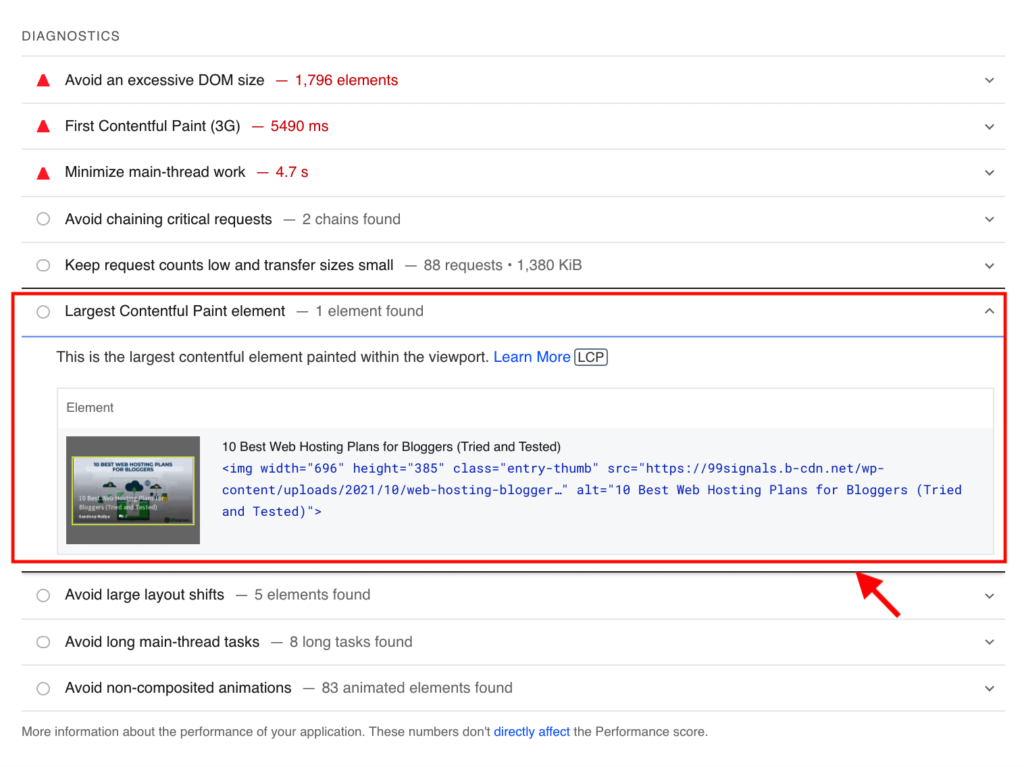
As you can see, there are several URLs on my site that have an LCP issue on mobile devices. In order to fix these CWV issues, it’s best to use PageSpeed Insights. PageSpeed Insights performs a detailed analysis of your website and provides recommendations on fixing all the CWV issues.
You can find more information on LCP in the Diagnostics section of the report.
If you’re using Semrush, you can perform a side audit and refer to the Core Web Vitals column in the Site Audit overview report. When you click through the number, you can see the errors that you need to fix to improve your CWV score.
You’ll also see recommendations and tips on the necessary steps you need to take to improve your overall CWV score.
5. Mobile Traffic
The “mobilegeddon” algorithm update in mid-2015 completely flipped the search landscape. Websites that hadn’t embraced mobile-friendly design yet saw their rankings plummet overnight. Even renowned publications and companies couldn’t escape Google’s wrath.
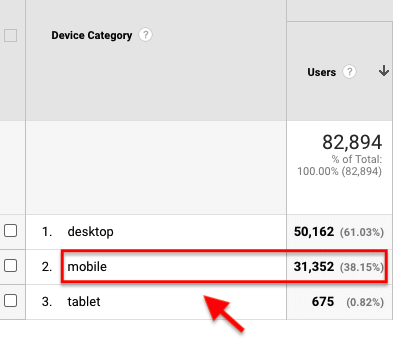
Image Credit: Marketoonist It is perhaps the single most important algorithm update from Google since the Panda algorithm update. Fast forward to today, the importance of mobile traffic has only increased. In fact, as of July 2021, 56.75% of all web traffic comes through mobile devices. Here’s how Google explains the importance of having a mobile-friendly website: If not mobile-friendly, a site can be difficult to view and use on a mobile device. A non-mobile-friendly site requires users to pinch or zoom in order to read the content. Users find this a frustrating experience and are likely to abandon the site. Alternatively, the mobile-friendly version is readable and immediately usable. This is why you should keep an eye on the mobile friendliness of your website design and make sure you’re providing an optimized user experience to the mobile visitors on your site. If you operate in an industry where a large portion of your traffic comes from mobile devices, then this becomes an even more important metric to consider. You can get accurate data on your site’s mobile traffic in Google Analytics. Visit Audience > Mobile > Overview Here you’ll be able to see the data on traffic from mobile, desktop, and tablet.
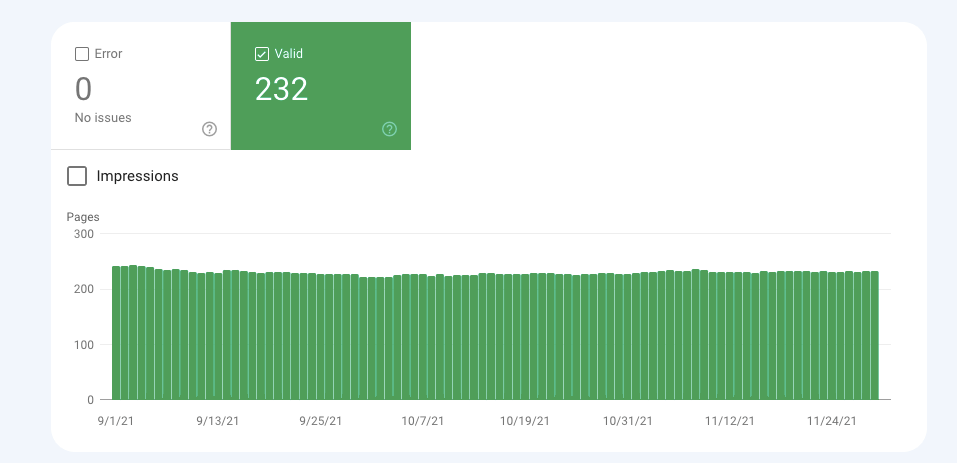
Once you’ve determined your mobile traffic, it’s important that you check the mobile usability of your site. You can easily check this report in your Google Search Console account. Navigate to Experience > Mobile Usability This report will show you the total number of mobile-friendly pages on your site.
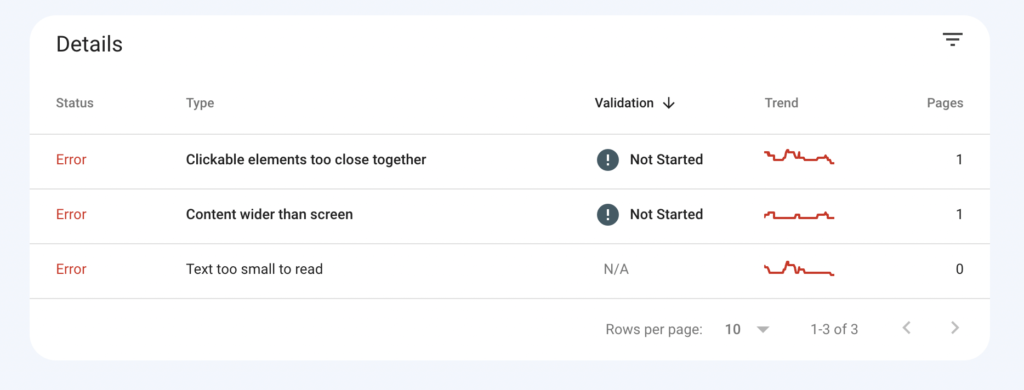
If Google identifies issues with the mobile interface of your website, then this report will pinpoint those exact issues. For instance, you may find that the clickable elements on your website are too close together or your content is wider than a mobile screen.
Fix these issues as and when they appear in this report to improve the mobile experience on your site. Once you’ve fixed these errors, return to the mobile usability report and perform a validation check on each error and see if the error is well and truly fixed. Another free tool you can use is Google’s Mobile-Friendly Test. As the name suggests, this free tool by Google lets you test the mobile-friendliness of your website. To use the tool, just enter your domain into the search box:
The resulting report will show whether or not your domain is mobile-friendly.
Use these free tools to ensure that your website performs well on all devices.
6. Indexed Pages
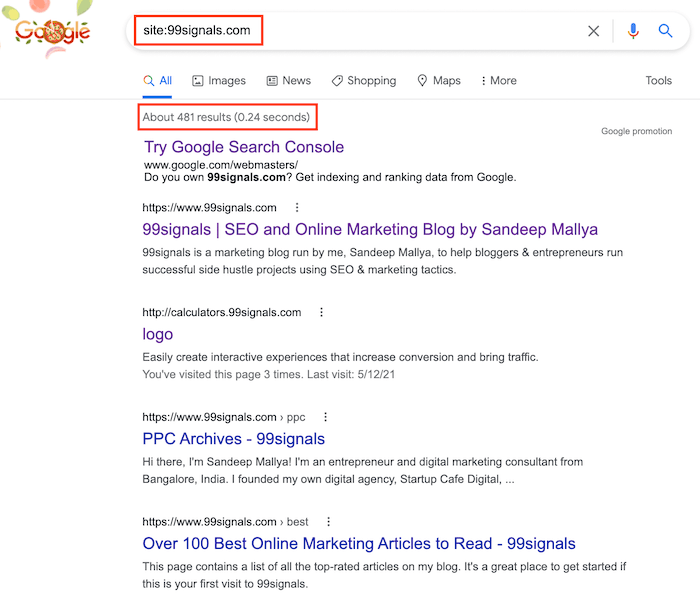
Indexed pages are pages that have been crawled by Googlebot and stored in the Google index. According to Google: A page is indexed by Google if it has been visited by the Google crawler, analyzed for content and meaning, and stored in the Google index. Indexed pages can be shown in Google Search results. In other words, this SEO metric simply shows you the number of pages from your site that are indexed by Google. Why is this important? While the number of indexed pages for your site doesn’t necessarily mean higher search rankings, it is a great indicator of how well your site is doing from an SEO standpoint. As a general rule, you’d want to make sure all the important pages on your site are indexed. At the same time, you’d want to leave a few pages out of the index. Why? Because having too many pages indexed can sometimes cause technical SEO issues like duplicate content, index coverage errors, and affect the overall website health score. There are three ways you can determine how many indexed pages you’ve got. The quickest way is to use a site search operator (site: yourdomain.com) in Google search like this:
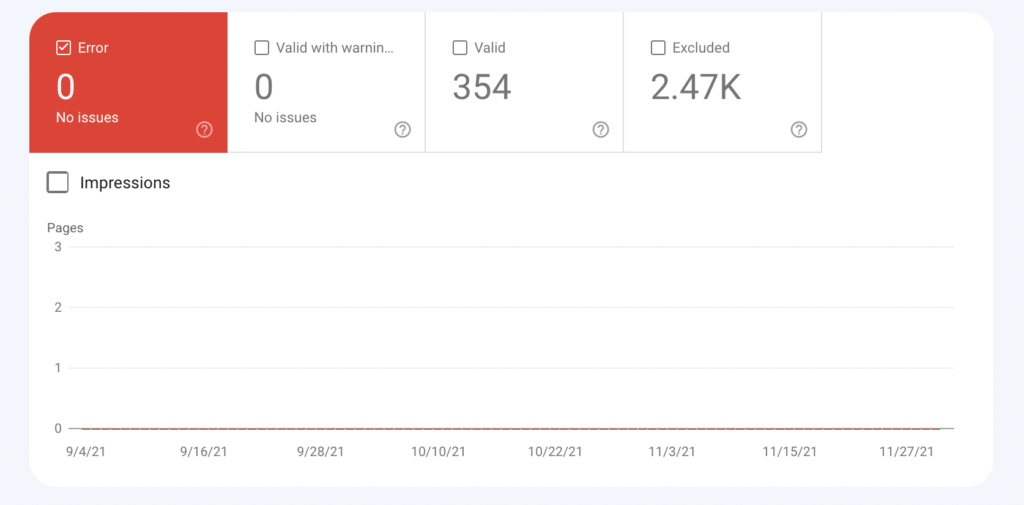
The search results will help you get a rough estimate of how many pages Google has indexed from your site. To get a more accurate summary of your indexed pages, check the coverage report in your GSC account. To access this report, go to: Index > Coverage Here you’ll not just find the precise number of pages from your site that Google has indexed, but also the errors that are preventing certain pages from being indexed.
Simply click through on an error to view the URLs that have issues. Alongside the URL, you’ll also find a link that includes instructions on how to fix the error.
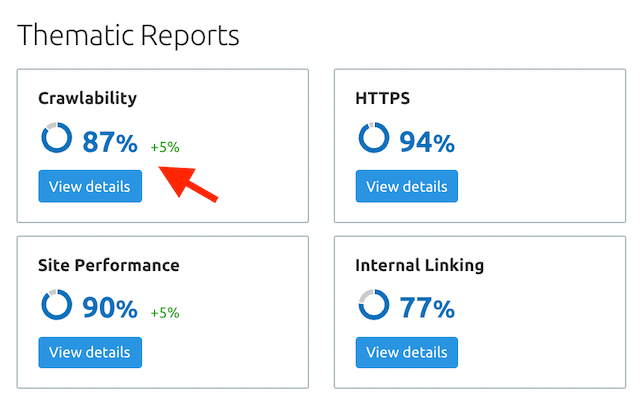
Check the coverage report in GSC every month to make sure your site has no index coverage issues. You can also identify index coverage errors with SEO tools that have a site audit feature. If you’re using Semrush, you can refer to the crawlability column under “Thematic Reports” in your site audit report.
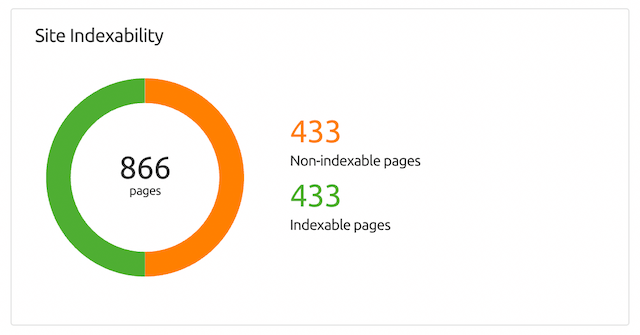
If you don’t get a 100% score here, that means your site may have indexability issues. If that’s indeed the case, hit the “View details” button to view the site indexability graph and other crawlability data.
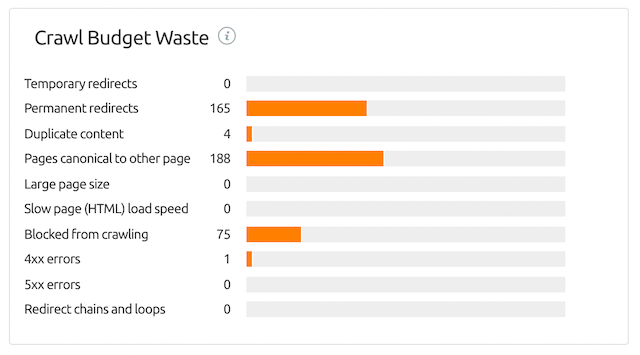
You can also check the Crawl Budget Waste column to identify all the pages on your site that are negatively affecting your website’s crawlability, and, as a result, reducing your crawl budget.
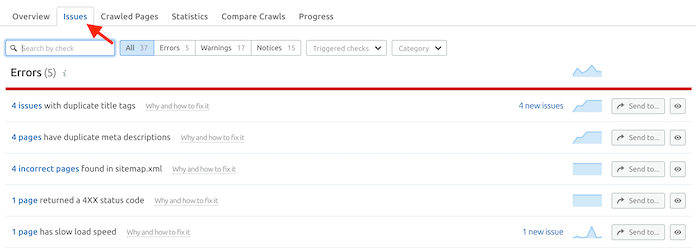
Finally, you can visit the “Issues” tab to see the exact indexability issues that are affecting your site.
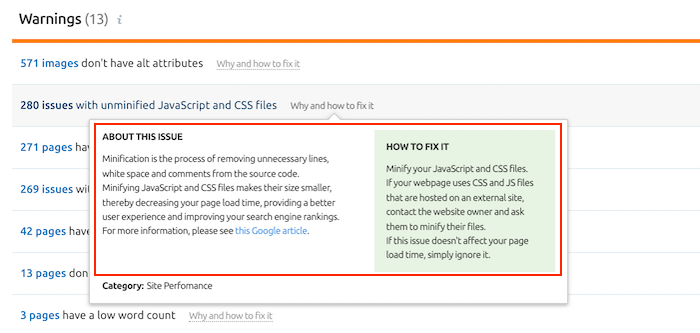
To learn more about these issues, click on the “Why and how to fix it” link against each issue. You’ll also get recommendations on how you can go about fixing each issue.
7. Traffic Cost
On the surface, this may seem like a PPC metric, but I’d consider it an important SEO metric. Why? Because it’s a clear indication of whether your SEO efforts are working. Traffic cost is the answer to the all-important, albeit annoying, question: What’s the ROI of SEO? As an SEO professional, if you’ve ever had to tackle this question, you’d know the role it plays in you retaining your clients in the long run. Traffic cost is the best SEO metric that can explain ROI in terms of dollars. Traffic cost is an estimate of how much you’d spend on Google Ads to generate the same traffic you’re currently getting from organic search. You can see your site’s traffic cost in Semrush. From the SEO dashboard, navigate to: Competitive Research > Organic Research Just plug your domain in the search box and in the resulting overview report, you can see your site’s traffic cost alongside other key SEO data points.
You can also see your traffic cost in Ahrefs. They call it traffic value, but it’s the same metric. Keep in mind that this number is just a rough estimate of how much your search traffic is worth. You can’t expect 100% accuracy.
8. Website Health Score
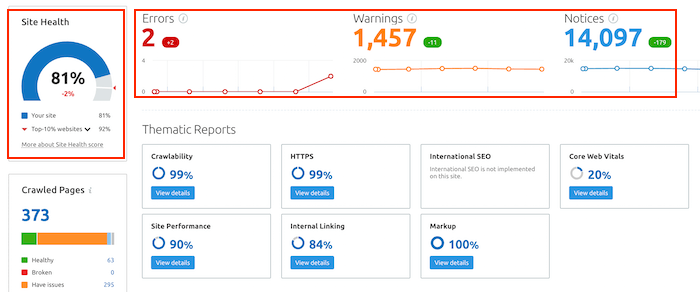
Your website’s health score is essentially the technical SEO score of your website. The higher the score, the less you need to worry about technical SEO. SEO performance tools that have the site audit feature crawl your website and update your health score accordingly. Semrush’s site audit tool is by far the best tool to measure the technical SEO health of your website. Every time you run a site audit on this tool, Semrushbot crawls your website and runs checks for over 140 common website issues. Essentially, Semrush calculates your site’s health score based on the issues it finds during the crawl.
These issues are classified into three main categories:
Errors – these are the most critical issues that have the highest impact on your site’s health score. These errors include indexability issues (see #6), broken internal links, missing title tags, slow site speed, etc. Warnings – these issues are of medium impact. For example, low text-HTML ratio, unminified JavaScript and CSS files, and broken external links are classified as warnings. Notices – the least important issues that have very little impact on your site’s health score. These issues include orphaned pages in Google Analytics, lack of internal links, links with non-descriptive anchor text, etc.
Needless to say, you should first focus on fixing errors before moving on to issues found in warnings and notices. Each issue that you find in your site audit report contains a “Why and how to fix it” explanation next to it so you can fetch more details on the issue and Semrush’s recommendations on how to fix these issues.
Once you’ve fixed the most critical issues, you can re-run the site audit to check if your website’s health score has improved. Learn more: Semrush Site Audit: 10 Most Overlooked Features
9. Average Clickthrough Rate (CTR)
Average clickthrough rate (CTR) is the percentage of users who click through your site in Google SERPs. So naturally, the higher your CTR, the better your chances of consistently ranking on the first page of Google.
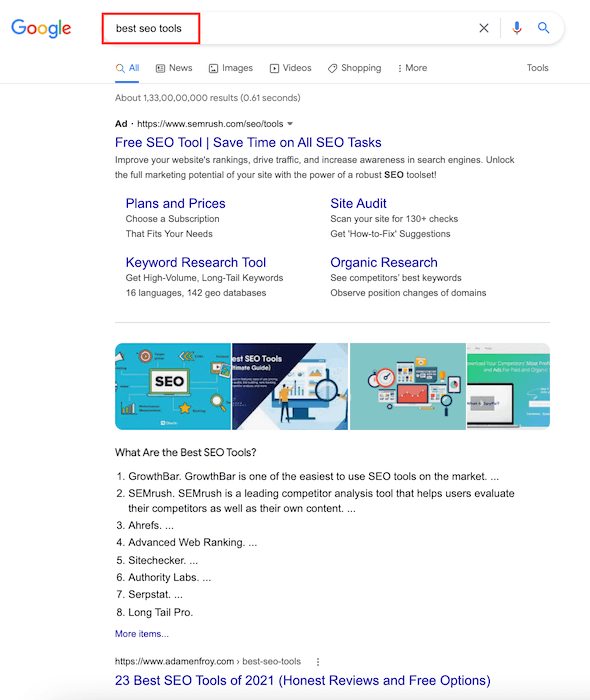
But when it comes to CTR, not all search results are created equal. Just because you rank at #1 for your target keywords doesn’t automatically translate to more traffic. Some search results will have a higher average CTR than others. Based on the keywords you’re targeting, some of your results may compete against featured snippets, Google ads, and more. Take a look at the SERP for this query:
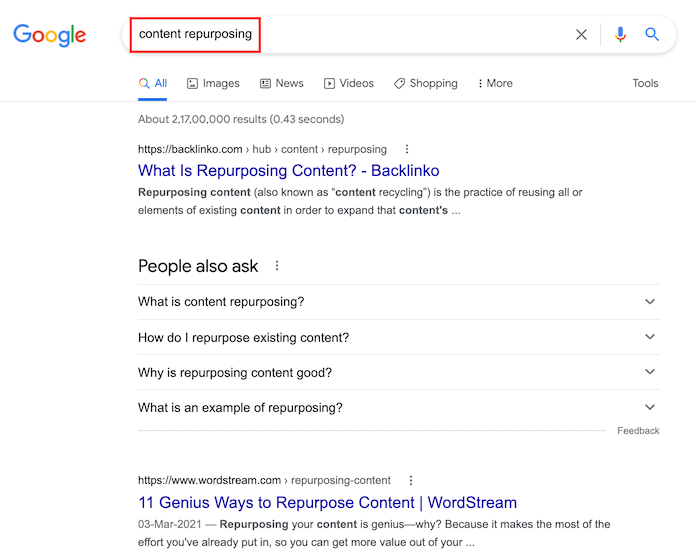
The SERP here is a combination of PPC ads, featured snippet, and more. As a result, your CTR may not be as high as the search volume suggests. Even if you rank at #1 for these keywords. And now, take a look at the SERP for this query:
As you can see, for this search query, there’s not a lot of competition. So the site ranking at #1 for these keywords will have a higher average CTR than the top result for the earlier search query. Now that you know the importance of this SEO metric, how do you go about measuring the average CTR of all your top-ranking pages? As much as I love Semrush, Ahrefs has a better feature to measure CTR. When you perform keyword research in Ahrefs, you get to see the average monthly number of clicks alongside search volume data for your keywords.
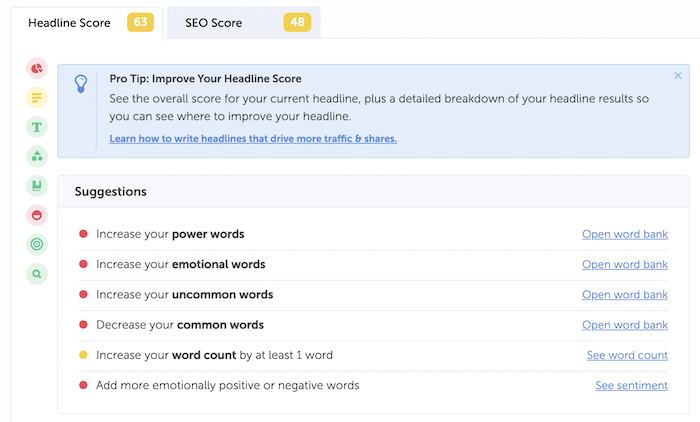
This is really helpful because you can then zero-in on keywords that have more traffic potential. Next question: how do you improve the CTR of your pages? You can start by optimizing the title tag and meta description of all your pages to make them as appealing as possible. Pro Tip: Use a free tool like Headline Analyzer to improve the quality of your headlines.
The tool scores your overall headline quality and rates its ability to result in increased traffic and social shares. Learn more: Meta Tags for SEO: The Definitive Guide
10. Bounce Rate
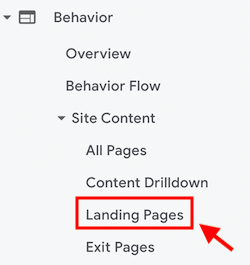
Bounce rate is the percentage of visitors who leave the website after visiting just one page. It’s often confused with pogo-sticking, but there’s a subtle difference. Pogo-sticking is a scenario where a user quickly navigates back to the SERPs to visit another page. Bounce rate, on the other hand, is when a user enters a site from any source and doesn’t perform any action. In other words, when a user visits a page and doesn’t click on any any of the links or put an item in their cart, it’s counted as a bounce. This is how Google defines bounce rate: A bounce is a single-page session on your site. In Analytics, a bounce is calculated specifically as a session that triggers only a single request to the Analytics server, such as when a user opens a single page on your site and then exits without triggering any other requests to the Analytics server during that session. Bounce rate has been getting a bad rap in recent years from the SEO community. In fact, Ahrefs published a post on SEO metrics in which they explained why bounce rate is not an important SEO metric. In a way, Ahrefs is right. For years, SEOs used to obsesses over this metric, while ignoring other important SEO metrics already featured on this list. This obsession would sometimes be at the cost of ignoring crucial SEO metrics like keyword rankings, referring domains, and technical SEO health. In fact, I still work with SEO clients who are obsessed with this metric. Having said that, bounce rate should not be completely ignored. It’s still a critical user experience signal. Ignoring it completely will most likely prevent you from making improvements to the content and user experience on your website. When Backlinko conducted their analysis of 11.8 million Google search results, they found a strong correlation between low bounce rate and higher search rankings. So how do you check your bounce rate? It’s quite simple: Google Analytics to the rescue again. Login to your Google Analytics account and navigate to: Behavior > Site Content > Landing Pages
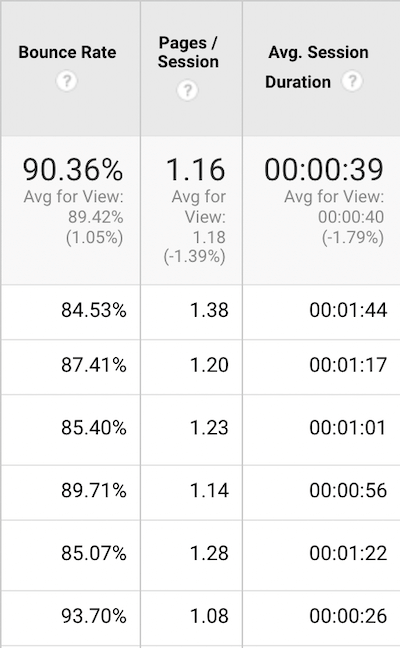
Here, you’ll get a breakdown of all the pages on your website alongside different analytics data points. The column you should pay attention to is “Bounce Rate.”
Obviously, the lower your bounce rate, the better. The other column you should pay attention to is “Avg. Session Duration.” This metric is also called “Dwell Time” and it reveals the time spent by users once they land on your site. While there are several ways to improve your bounce rate, the best way is to speed up your website. Use Google’s free PageSpeed Insights tool to test your site speed and to get specific recommendations on improving the speed and performance of your website.
Final Thoughts on SEO Metrics
If you’d like to understand the value of your SEO efforts, you need to make sure you’re tracking and reporting on the right SEO metrics. In this guide, I’ve made an attempt to provide insights on the most important metrics you should track and analyze to improve your overall SEO performance. Now I’d like to hear from you… Do you agree that these 10 SEO metrics are important? Which ones do you track on a regular basis? And which ones, in your opinion, are overrated? Let me know in the comments section below. I’d love to hear your thoughts on this topic. Let’s keep the conversation going. If you found this article useful, please share it on Twitter using the link below:
Google E-A-T: How to Create Content That Ranks Higher on Google Meta Tags for SEO: The Definitive Guide SEO Tools Showdown: Semrush vs Ahrefs vs Moz vs SpyFu 25 Best Google Chrome Extensions for SEO Semrush Site Audit: 10 Most Overlooked Features

![]()
![]()
